Every quantitative method starts with calibration. We prepare multipoint calibration curves using well-characterized reference standards, produced in-house where possible. A minimum of three concentration levels documents linearity across the analytical range and ties the final result to a weighed, known quantity. Results are reported as milligrams per gram or percent weight by weight, and we ensure the r2 meets specification before reporting data from any calibration curve.
Comparing Detection Methods
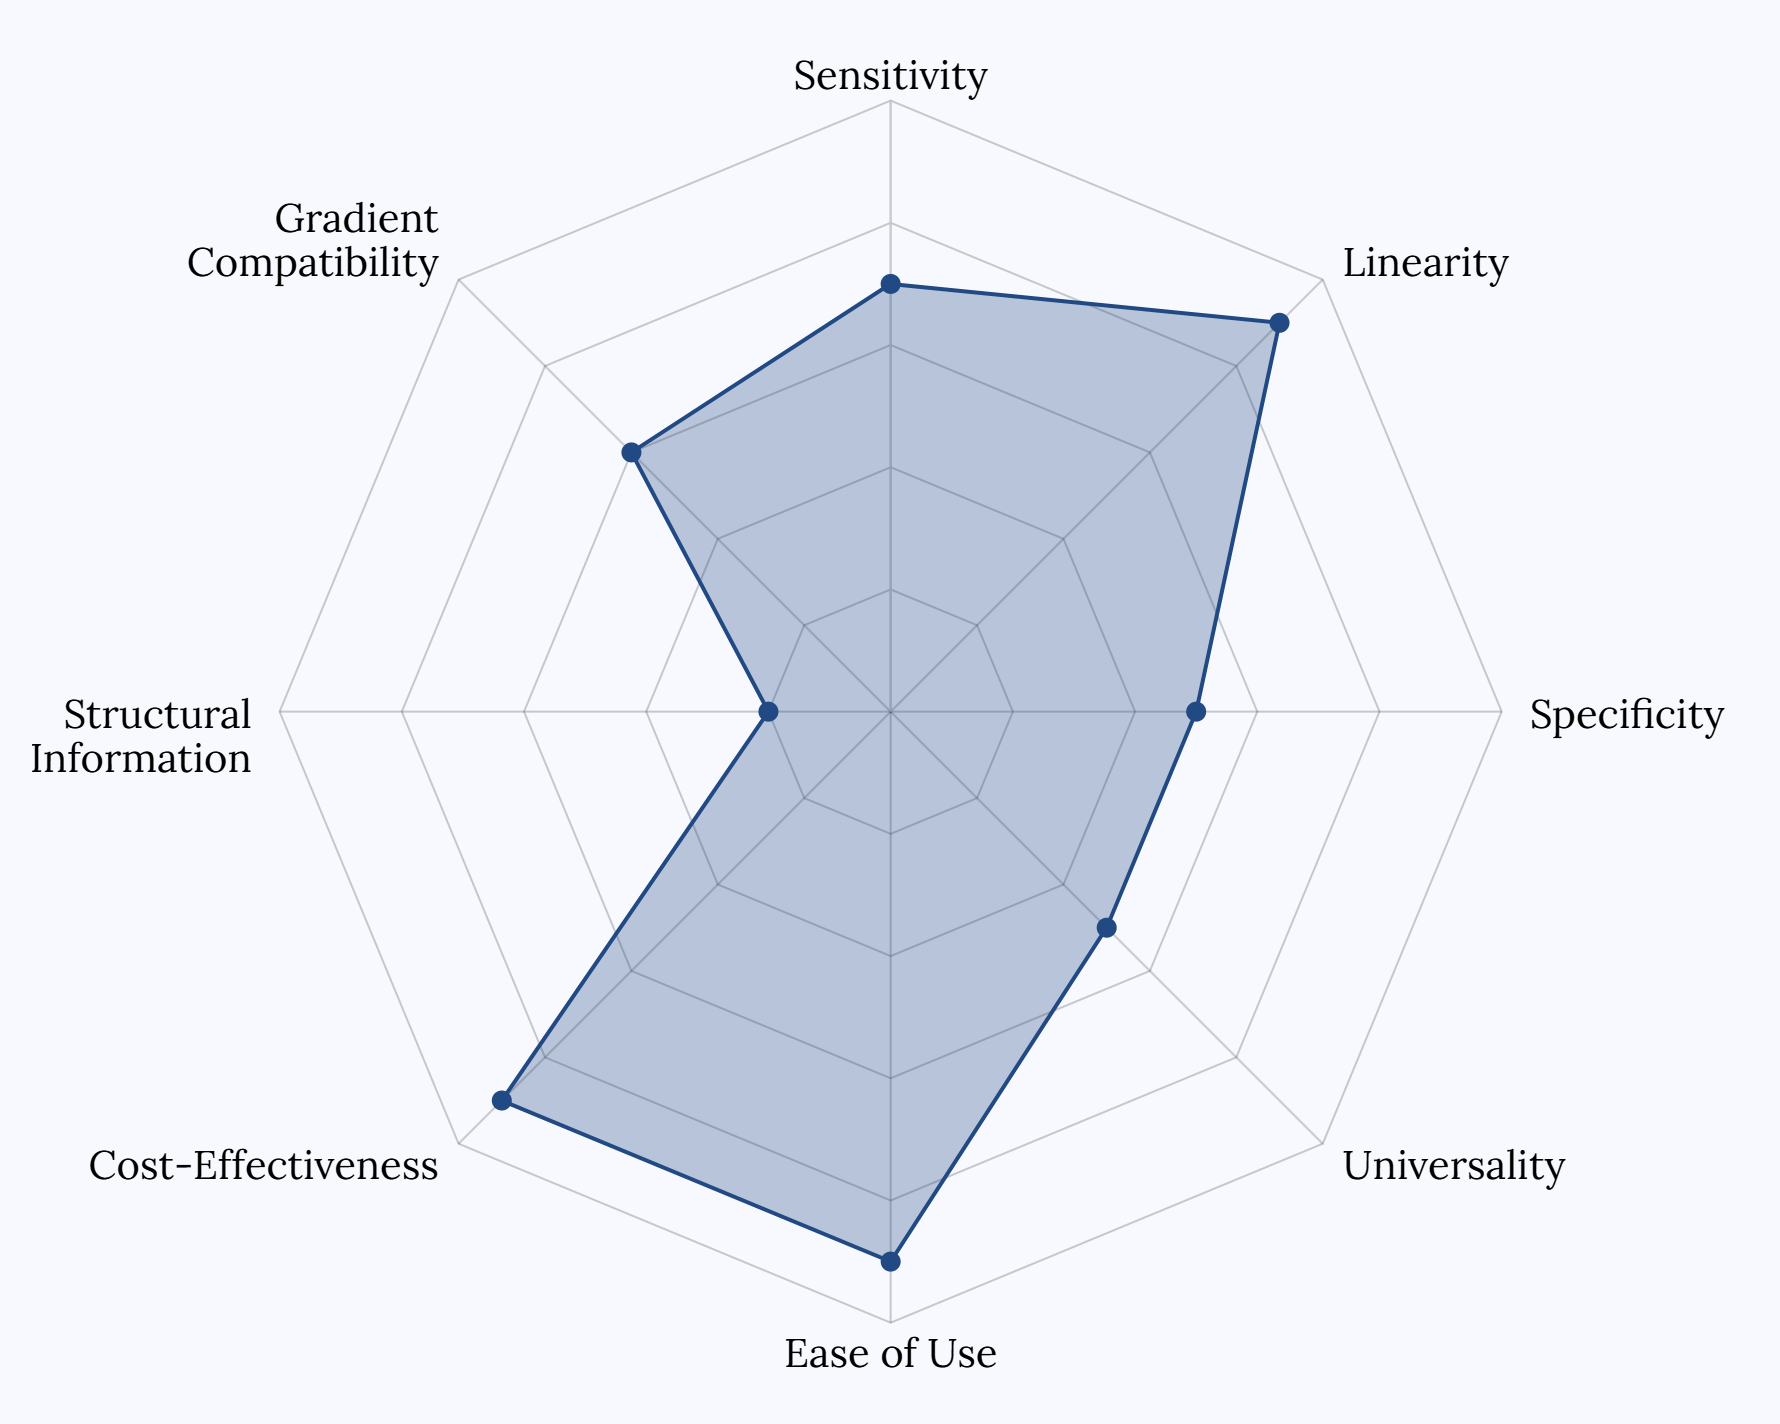
UV Detection
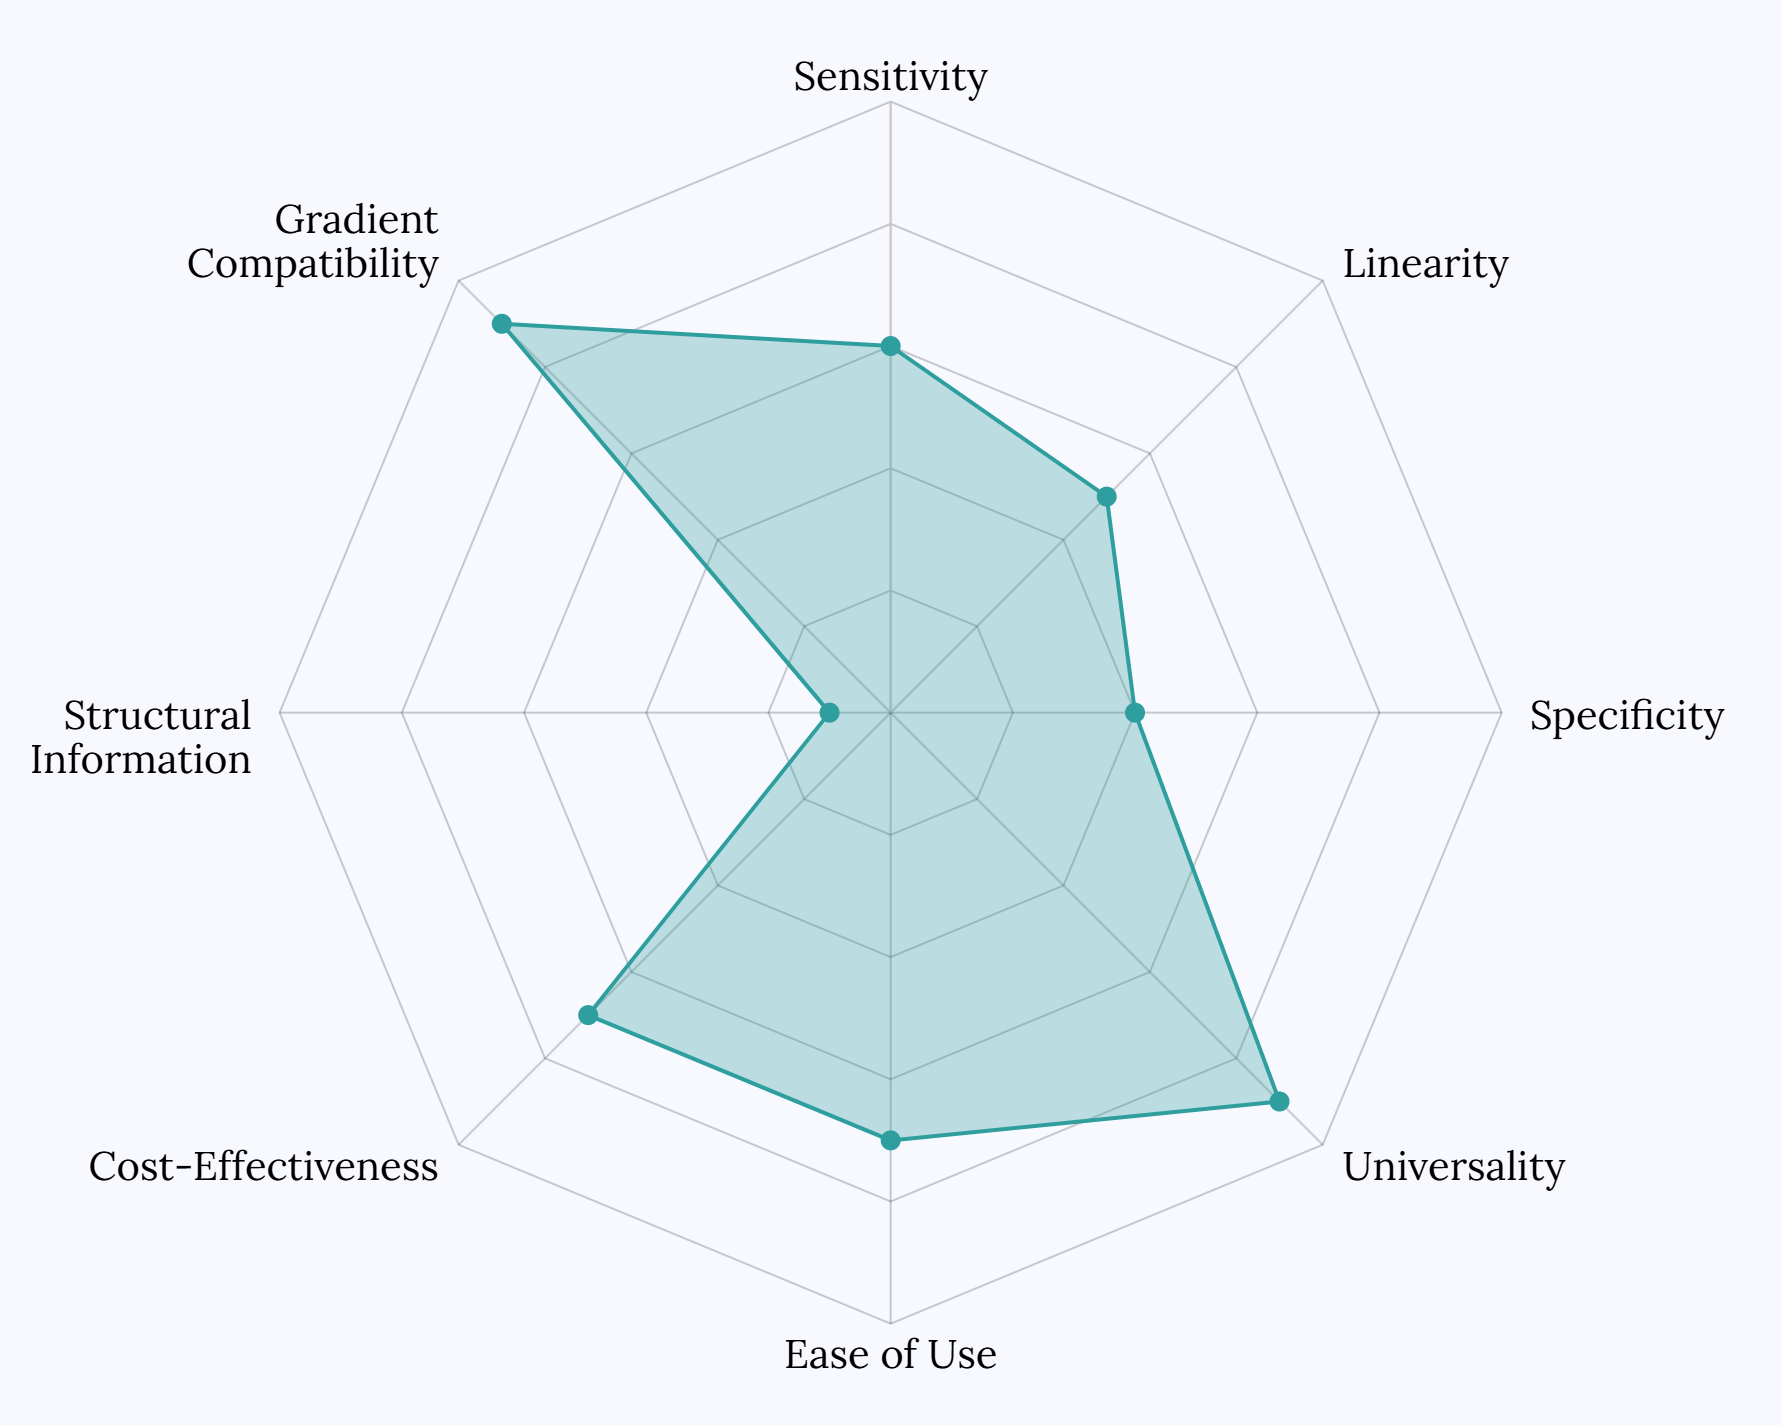
ELSD Detection
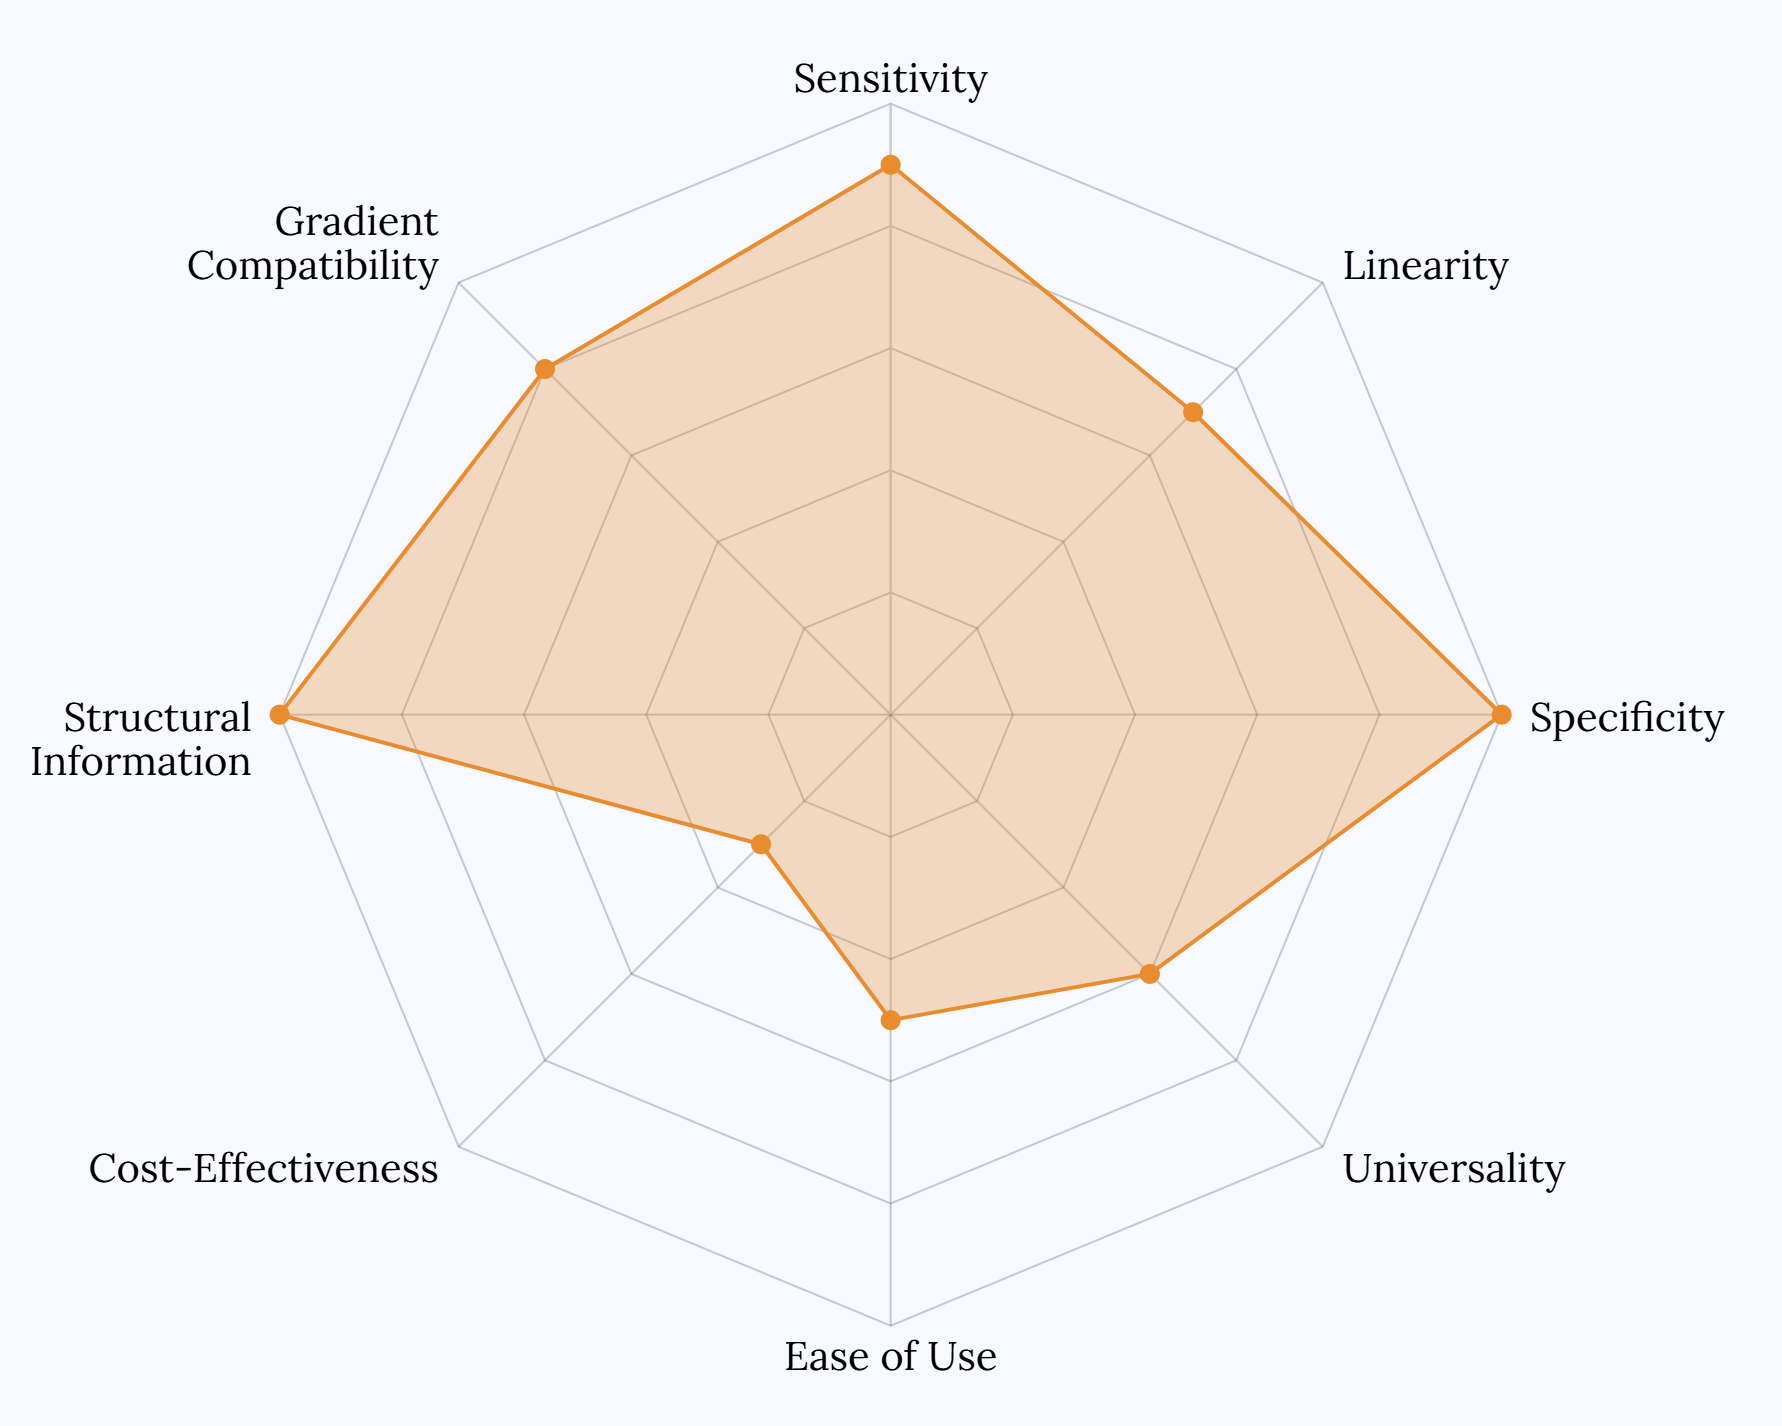
MS Detection
Qualitative and quantitative HPLC are different services with different outputs.
The distinction matters when a result needs to support a label claim, a regulatory filing, or a commercial specification.
* The Investment Level row reflects a real difference in scope. A quantitative method requires gravimetrically prepared standards at multiple concentrations, documented validation parameters, and a complete data package. When the result needs to support a label claim or a regulatory filing, a screening method is not a cheaper alternative to quantitative analysis. It is a different service that does not satisfy the requirement.
Why Analytical Quality Drives Market Value
Good quantitative data does more than satisfy a regulatory checkbox.
In markets where ingredients are bought and sold on declared potency, the analytical result is part of the product.
Defensible label claims build buyer confidence.
When a label declares 10% glucosinolates or 500 ppm azadirachtin A, distributors, formulators, and retailers are taking that number at face value. Quantitative data from a validated method with traceable standards gives them a real basis for that trust. A screening result does not.
Consistent potency data strengthens supply chain relationships.
Ingredient suppliers who ship with quantitative CoA data reduce the QC burden on their customers. That reliability accumulates. Buyers who receive consistent, well-documented results are less likely to switch suppliers and more likely to specify that supplier in their own sourcing requirements.
Premium positioning requires supporting documentation.
Ingredient suppliers who ship with quantitative CoA data reduce the QC burden on their customers. That reliability accumulates. Buyers who receive consistent, well-documented results are less likely to switch suppliers and more likely to specify that supplier in their own sourcing requirements.
Quantitative monitoring catches supply chain problems early.
Potency drift between crop years or between supplier lots is easy to miss with a rough screen. A quantitative monitoring program catches the shift as it happens, giving manufacturers time to act before a batch goes out the door.