Part 1 of a 2-part post on the differences between qualitative and quantitative analysis. The goal is to demystify the terminology and help you make the right decision for your product.
Your Certificate of Analysis Says 90%. Your Product Has 30%. Here Is Why That Happens
A supplier hands you a certificate of analysis. The active compound reads 92%. You launch the product, a regulatory reviewer requests independent verification, and the number comes back at 28%. Same material. Same batch. Very different methods.
This is not an edge case. It happens across botanical extracts, nutraceutical ingredients, agricultural actives, and pharmaceutical intermediates whenever the method used to generate a number does not match the question that number is supposed to answer.
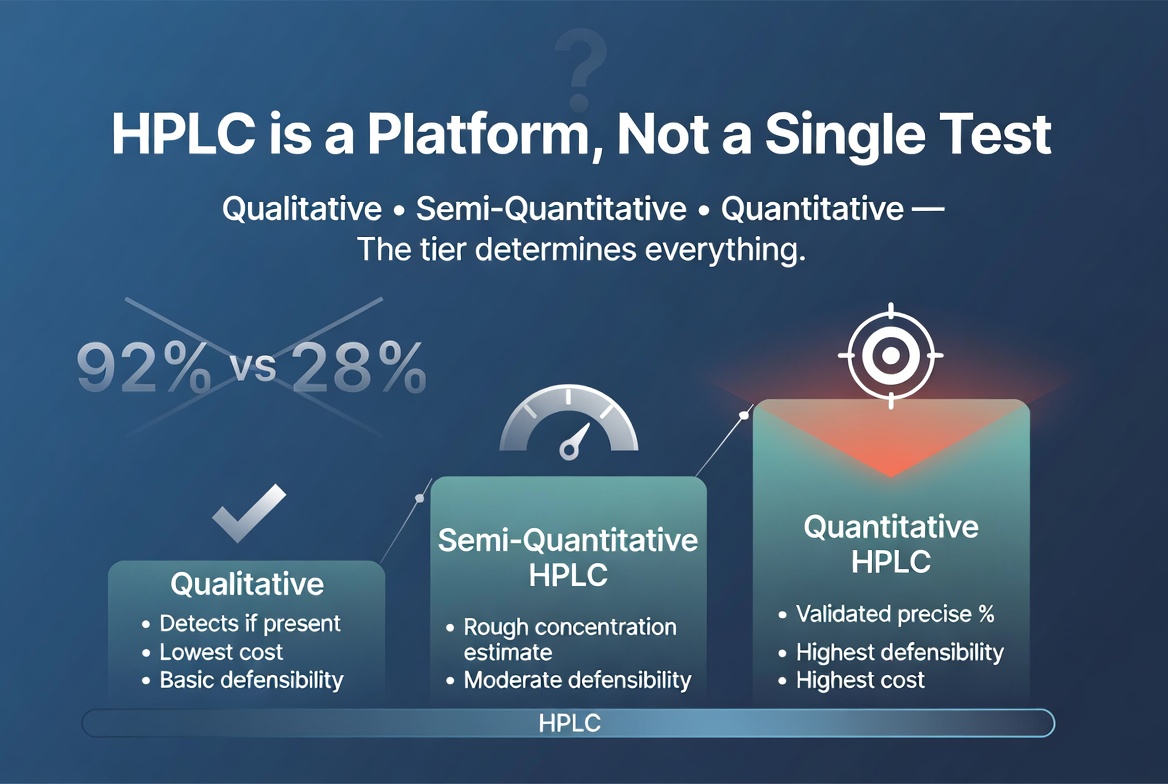
The root issue is that HPLC is a platform, not a single test. The words on the report “analyzed by HPLC” tell you almost nothing on their own. What matters is which tier of analysis was performed: qualitative, semi-quantitative, or quantitative. Those three approaches produce fundamentally different outputs, carry different levels of defensibility, and cost very different amounts. Understanding the distinction before you commission work or before you rely on someone else’s work is one of the more practical things you can do for your product.
The Three Tiers of HPLC Analysis
Qualitative HPLC
Qualitative analysis answers one question: is this compound present in the sample? The HPLC instrument separates the mixture and the analyst looks for a peak at the expected retention time, sometimes confirmed by the UV absorption profile or a mass spectrum. No standard curve is built. No concentration is calculated. The result is a statement of identity: detected or not detected. This level of work suits screening, incoming material checks, or confirming that an extract contains the target class of compounds before committing to deeper analysis.
Semi-Quantitative HPLC
Semi-quantitative analysis moves toward a number, but not to a defensible one. The most common approach is UV peak area normalization: the analyst expresses the area of the target peak as a percentage of all detected peaks. This gives a relative abundance, not an absolute concentration. A variation uses a single reference standard at one concentration to anchor the calculation. Neither approach accounts for differences in detector response between compounds, matrix suppression, or the full relationship between concentration and signal. The result is an estimate: useful for internal trending, but not for a label claim.
Quantitative HPLC
Quantitative analysis is built to produce a defensible number. A certified reference standard is weighed gravimetrically on a calibrated analytical balance and dissolved to a known concentration. Serial dilutions produce a multipoint calibration curve, typically five to seven points, spanning the expected sample range. The curve must meet linearity criteria (r2 ≥ 0.998 is a common minimum). The sample is prepared in parallel and its concentration is read against the curve. Accuracy and precision are reported alongside the result. This is the tier that supports label claims, regulatory submissions, and contractual specifications.
HOw a 92% Result Becomes and 28%: ILLUSTRATIVE Example
Suppose a concentrated botanical extract is analyzed by semi-quantitative HPLC using UV peak area normalization. The target compound, a polyphenol with a strong chromophore, appears as the dominant peak. Because UV detects chromophore-bearing molecules preferentially, that peak looks large relative to the others. Normalization assigns it as 92% of the total area.
Now the same extract is analyzed by quantitative HPLC with a gravimetrically prepared reference standard and a validated seven-point calibration curve. The curve establishes that the actual concentration in the prepared sample corresponds to 28% of the dry weight. The discrepancy is not measurement error. It has a structural explanation.
First, the extract contains co-eluting compounds that share similar retention times with the target. The single large peak in the semi-quantitative run was actually two or three overlapping peaks. Second, other compounds present in the extract do not absorb strongly at the UV wavelength used, so they represent a smaller share of total area than they represent of total mass. Third, without a calibration curve, the analyst had no basis to convert detector signal to absolute mass. The normalization approach is internally consistent but disconnected from ground truth.
Note: The 92% and 28% figures above are illustrative. The direction of the effect (normalization overstating concentration) is common in practice, but the magnitude depends on the matrix, target compound, and detection wavelength.
Detection Modes: UV, ELSD, and MS Are Not Interchangeable
The detector at the end of the HPLC column determines what the instrument can see and how it responds. No detector is inherently accurate in its purity assessment. Each provides different information and each has blind spots.
UV/DAD
UV and diode array detectors measure light absorbance at specific wavelengths. Compounds with strong chromophores produce large signals. Compounds without them produce small signals or none at all. Normalization against UV area therefore systematically overstates compounds that absorb well and understates those that do not. UV is well suited to quantitation when a matched reference standard is used, but peak area alone is not a purity number.
ELSD (Evaporative Light Scattering Detection)
ELSD measures all non-volatile analytes regardless of chromophore, which makes it useful for sugars, lipids, and other UV-transparent compounds. The trade-off is that ELSD response is non-linear: doubling the mass does not double the signal. ELSD data requires careful calibration and is less straightforward to use for accurate quantitation than UV when a linear range can be established. ELSD is most valuable as a complementary tool or for analyte classes that UV cannot see.
MS (Mass Spectrometry)
Mass spectrometry is the most powerful tool for confirming compound identity. It provides molecular weight and fragmentation patterns that can distinguish structural isomers and identify unknowns. MS is not inherently quantitative: ionization efficiency varies between compounds, and ion suppression from matrix components can reduce the signal for a target analyte independently of concentration. Accurate quantitation by LC-MS requires the same fundamentals as any other approach: a matched reference standard, a validated calibration curve, and documented method performance. MS adds identity confirmation on top of quantitation; it does not replace the quantitative framework.
What Kind of CoA Are You Actually Holding?
A certificate of analysis is a business document as much as an analytical one. Its value is determined by what it says and by how well the work behind it can be defended.
A qualitative CoA confirms identity. It tells a buyer that the compound is present. This supports screening and incoming QC, but it does not support a label, a spec sheet, or a regulatory filing.
A semi-quantitative CoA carries a number, but that number is an estimate. If a buyer or regulator asks how it was calculated, the honest answer is that it reflects relative area under a UV curve, not an independently verified concentration. In a business-to-business context, that distinction matters. Buyers who understand the difference will discount the number. Buyers who do not understand it and later find out tend not to become repeat customers.
A quantitative CoA provides a traceability chain: the reference standard lot, its documented purity, the calibration curve data, the method performance parameters, and the calculated concentration with uncertainty. That document can be handed to a regulatory reviewer, a contract manufacturer, a retail buyer, or opposing counsel and withstand scrutiny. It supports label claims in regulated markets, ingredient specifications in supply agreements, and the pricing premium that goes with verified potency.
The difference between a qualitative CoA and a quantitative CoA is not just analytical. It determines what you can say about your product, where you can sell it, and at what price.
What Each Tier Costs
Price ranges across the industry vary based on lab capabilities, turnaround time, and sample complexity. The figures below represent typical commercial laboratory pricing for a single analyte in a relatively clean matrix. Multi-analyte panels, difficult matrices, and method development each add cost.
| Qualitative | Semi-Quantitative | Quantitative | |
|---|---|---|---|
| Typical Range | $100 – $250 | $200 – $400 | $800 – $1,500 |
| Reference Standard | None | Single-point | Multipoint curve |
| Calibration | None | External single std | Gravimetric, r2 > 0.99 |
| Result Output | Present/absent | Approximate % | Absolute concentration |
| Reportable CoA | Identity only | Indicative | Defensible |
| Typical Use | Screening | Batch Trending | Label claims, registration |
Reference standard procurement adds $300 to $500 or more per compound when a certified standard is not already available in-house. This cost is often invisible in a quote but real in the total cost of defensible data. Some labs include it in the line item; others do not.
The price gap between semi-quantitative and quantitative work is real, but so is the gap in what the data can support. A result that cannot withstand a follow-up question is not cheaper. It redirects the cost to the moment the number is challenged.
Keep an eye out for the follow up post, framing out industry uses for the different types of analysis, as well as giving some additional depth about standards and certificates.